

ENEREX DATAHUB POWER MARKET BRIEF | ILLINOIS 2026
By Nate Richards, Enerex
I was reading a summary of the Illinois Commerce Commission’s 2026 Office of Retail Market Development report in a MagniFYI featured article by David Givens when one number stopped me.
37% year-over-year growth in ComEd C&I customers on competitive supply?
That didn’t pass the smell test. The report showed a 36.7% increase in competitively served nonresidential customers and a 21.7% increase in their electricity usage. If that much growth had occurred, I wanted to understand where it came from.
So I opened DataHub Market Share Nowcast.
DataHub showed the opposite trend
DataHub gives us a consistent view of market size and supplier market share. Its Illinois view showed the total competitive customer base contracting, not growing, with different supplier parent companies gaining or losing share inside that smaller market.
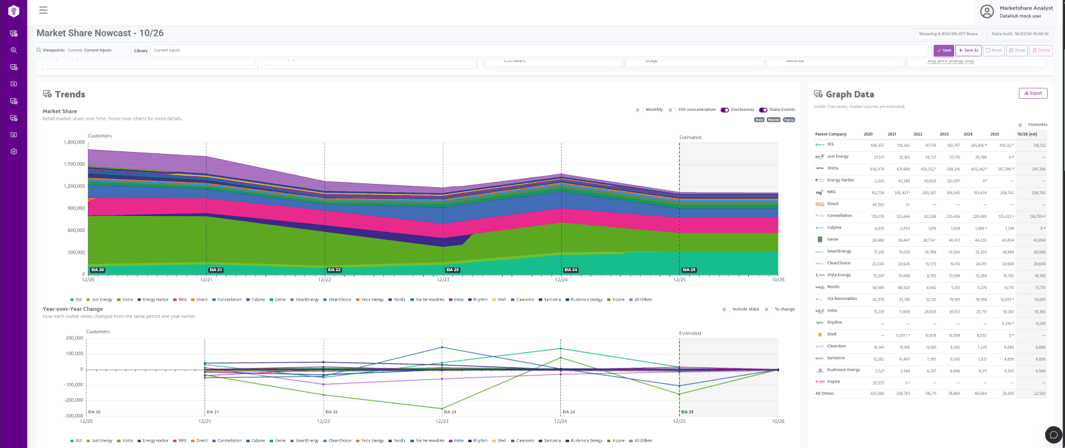
The ICC’s own monthly switching workbooks confirm the same direction. From May 2025 to May 2026, combined competitive residential accounts declined 3.29%, combined nonresidential accounts declined 1.81%, and total competitive accounts declined 3.03%. Competitive May energy also declined: 4.46% for residential load, 1.45% for nonresidential load, and 1.78% overall.
DataHub adds the supplier-level view. It lets us see whether a market movement reflects actual market growth, share shifting among known suppliers, or more of an existing total becoming attributable as new evidence arrives. Market Share Nowcast combines regulatory data, company disclosures, and market events to estimate the market today, rather than waiting for the next annual EIA release.
See the market before the annual filings catch up
If your team needs defensible market size, supplier share, and competitor movement—not another static spreadsheet—see Market Share Nowcast in action.
The Excel range behind the headline
The published comparison used a partial ComEd nonresidential total for May 2025 and the full nonresidential total for May 2026.
In the ICC’s 2025 ComEd workbook, on the 05 MAY 2025 sheet, summing H11:L11 gives 116,197 competitive customers. That is exactly the 2025 baseline printed in the ORMD report. But the full nonresidential total in P11 is 159,466.
The narrower range leaves out Watt Hour, High Voltage, Railroad, and Lighting/Other. Those four categories account for 43,269 customers that already existed in May 2025.
The 2026 workbook reports 158,856 competitive nonresidential customers in P10 on its May sheet. Compare that full total with the partial 2025 baseline and you get the reported growth. Compare full totals in both years and you get a slight decline:
Published comparison: 158,856 / 116,197 - 1 = +36.7%
Same classes both years: 158,856 / 159,466 - 1 = -0.38%
The published result is exactly what you get when an Excel SUM range misses four categories. We can reproduce the range mismatch from the public data; we have not inspected the ICC’s internal report-building workbook.
The same omission affects electricity usage. The report’s 2025 value matches SUM(H21:L21), leaving out 671,847,281 kWh from those four categories. On a consistent basis, ComEd nonresidential competitive usage declined 1.66%, rather than growing 21.7%.
A different picture of the market
| Measure | ORMD reported | Consistent scope |
|---|---|---|
| ComEd nonresidential competitive customers | +36.7% | −0.38% |
| ComEd nonresidential competitive usage | +21.7% | −1.66% |
| Combined competitive customers | +0.01% | −3.03% |
| Combined competitive usage | +11.7% | −1.78% |
Published figures: ORMD 2026 report, Table 1, printed page 6. Corrected figures reconcile to the ICC monthly switching filings. Combined figures cover ComEd and Ameren.
These are May-to-May comparisons: customer counts for those months and one month of electricity usage in each year. They are not annual energy totals.
That distinction matters when you are sizing a market. Finding additional supplier volume in a disclosure does not automatically mean the total market grew. It may simply explain more of the load already inside the market total.
One supplier-level question remains open
Vistra’s Illinois retail sales and customer counts in its most recent EIA-861 filings appear low relative to the broader ICC market envelope and other available evidence of its Illinois retail activity. Enerex has asked Vistra’s regulatory reporting team to clarify the filing’s scope and methodology but had not received a substantive response as of this post.
DataHub retains the EIA values as reported while treating the resulting Vistra market-share estimate as provisional. This uncertainty does not change the ICC-derived market total; it affects how that total is allocated between Vistra and the currently unallocated portion of the market.
Want to pressure-test a market number before it becomes a planning assumption?
Book a DataHub demo and bring us the market question your team is trying to answer.
Then I asked our AI to draft the corrected market analysis
Once we had reconciled the numbers, I asked our AI to draft the retail market portion of an independent Enerex brief using the correct data from DataHub Market Share Nowcast.
The assignment was specific: use consistent customer classes, separate residential and nonresidential totals, distinguish customer counts from electricity usage, avoid treating May usage as annual energy, and tie every conclusion back to a source. We checked the calculations and reviewed the narrative against the published data.
The resulting Enerex DataHub Power Market Brief: Illinois 2026 is now available. It includes the corrected residential, nonresidential, and combined comparisons, the reporting-year view, and the reconciliation showing exactly which categories explain the apparent gain.
Get the full Illinois 2026 Power Market Brief
Submit the form to access the complete corrected market analysis. You’ll be taken directly to the report download.
Complete the short HubSpot form to access the download.
This is why we built DataHub. Suppliers need to know how large an opportunity really is and where they stand. Brokers need market information they can explain to customers. A number becomes much more useful when you can check what it includes and follow it back to the source.

P.S. I have notified the ICC via memo about this error. I’m confident they will re-issue the report with a correction soon.